The path to greater profit is more clear than ever. With this advanced system to monitor and improve sales performance, you can pinpoint sales opportunities to maximize return on investment. Every dealership that uses it has a chance to uncover an average of 300 units of incremental sales.
View the videoGain an unprecedented view of customer activity — who they are, how they shop and what they are buying in your territory.
Track and benchmark against the competition to see who is selling what in your territory. And how to strategize against competitive dealerships.
The most accurate and timely sales reports by model (weekly and monthly).
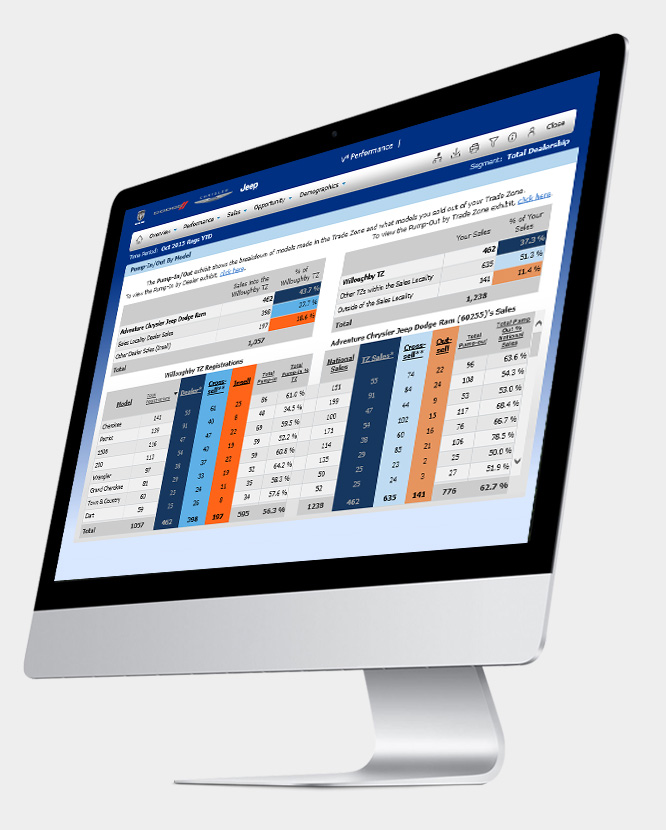
The Pump-In/Pump-Out exhibit shows the breakdown of which dealers sold into your Trade Zone by model and what you sold outside of your Trade Zone by model.
Gain an unprecedented view of customer activity — who they are, how they shop and what they are buying in your territory.
Track and benchmark against the competition to see who is selling what in your territory. And how to strategize against competitive dealerships.
The most accurate and timely sales reports by model (weekly and monthly).
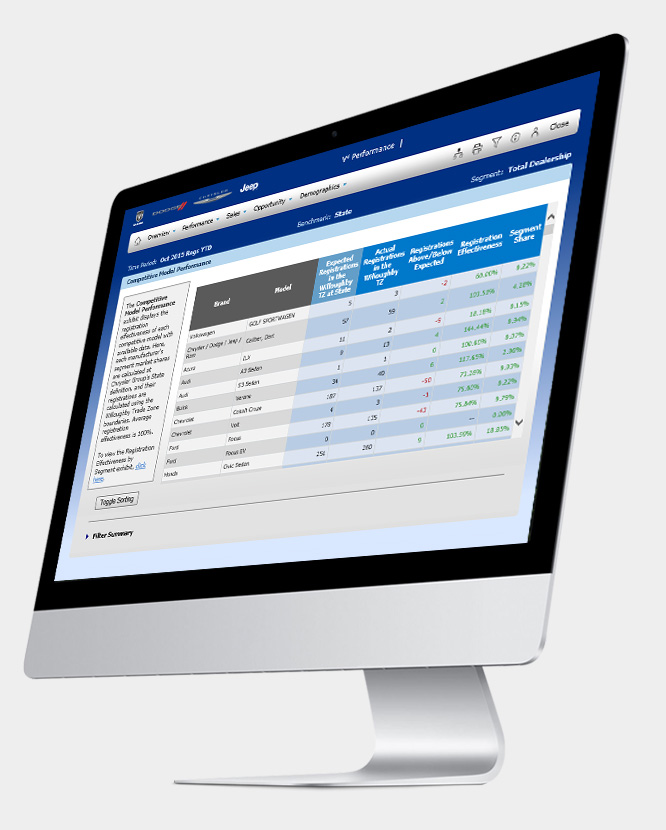
The Competitive Model Performance exhibit displays the registration effectiveness of each competitive model to understand the customer purchase preference in the Trade Zone.
Gain an unprecedented view of customer activity — who they are, how they shop and what they are buying in your territory.
Track and benchmark against the competition to see who is selling what in your territory. And how to strategize against competitive dealerships.
The most accurate and timely sales reports by model (weekly and monthly).
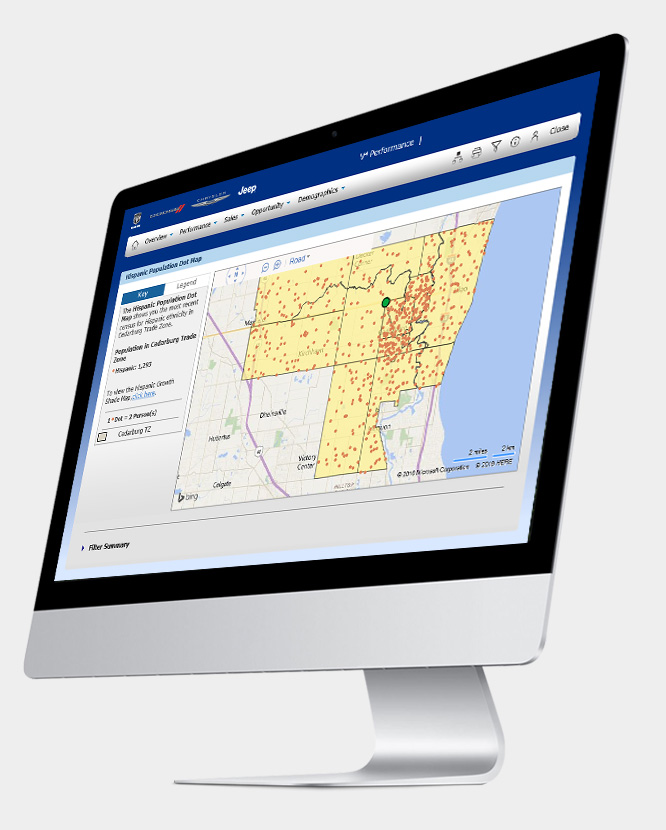
The Market Demographic Maps show the current and projected population trends in the Trade Zone.
Gain an unprecedented view of customer activity — who they are, how they shop and what they are buying in your territory.
Track and benchmark against the competition to see who is selling what in your territory. And how to strategize against competitive dealerships.
The most accurate and timely sales reports by model (weekly and monthly).
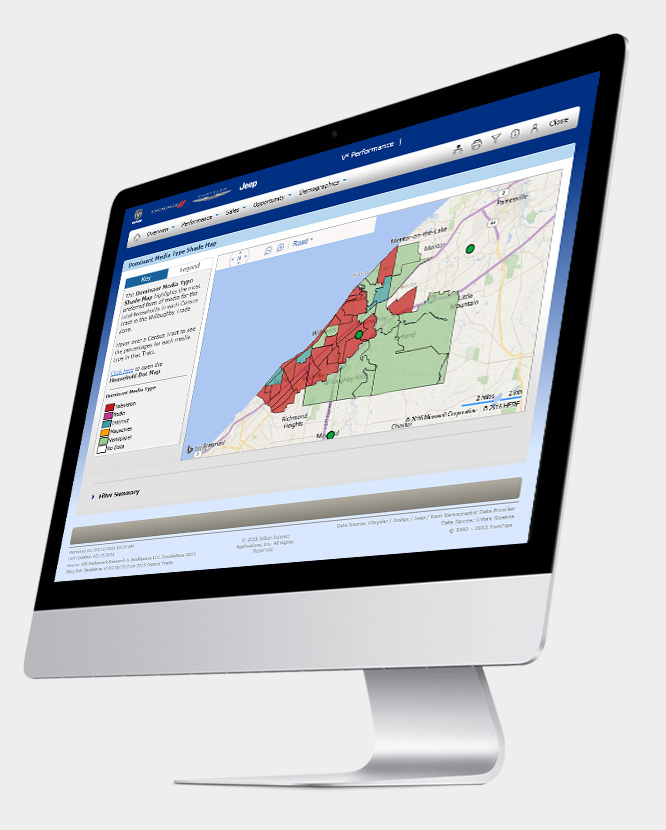
The Dominant Media Type Shade Map highlights the most preferred form of media for the total households in each Census Tract.
Uncover your missed new and used vehicle sales opportunities.
And you'll have the ability to quantify lost profit dollars and seize actual opportunities by building quick-response action plans to target actual customers.
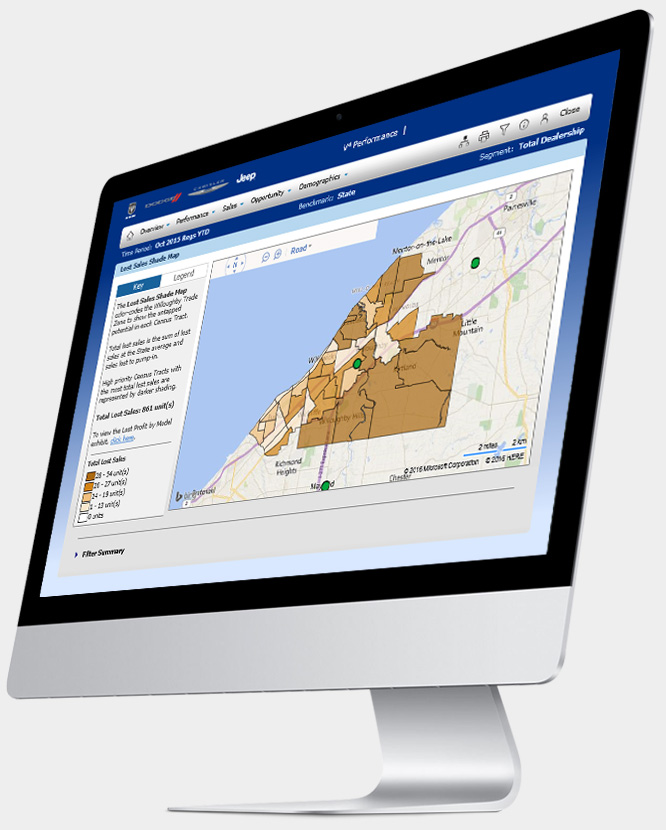
The Lost Sales Shade Map color-codes the Trade Zone to show untapped potential.
Uncover your missed new and used vehicle sales opportunities.
And you'll have the ability to quantify lost profit dollars and seize actual opportunities by building quick-response action plans to target actual customers.
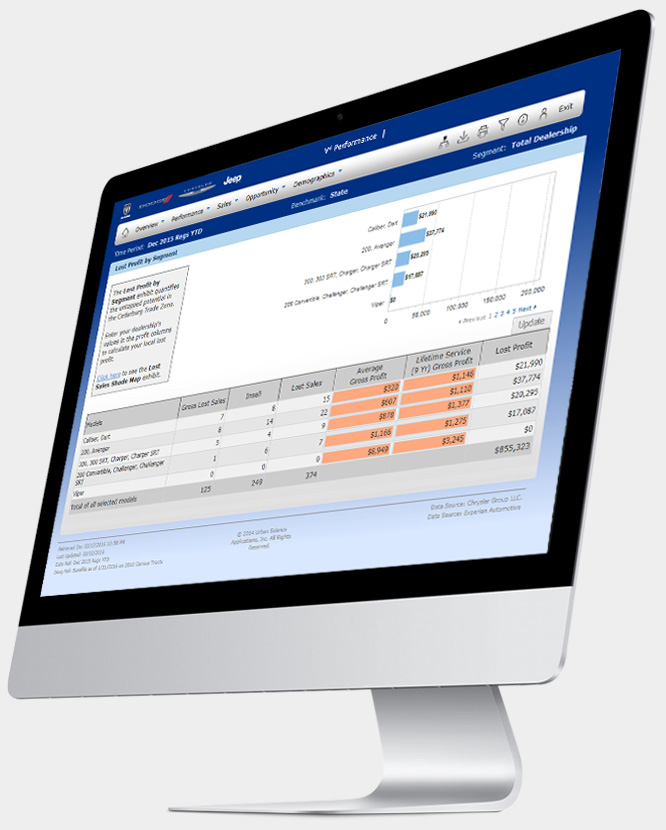
The Lost Profit by Segment exhibit quantifies the untapped potential in a given Trade Zone and translates it into potential profitability loss for the dealership.
Stay ahead of the constantly evolving market. Track weekly sales vs. your competitors, and receive key performance alerts so you can make fast decisions.
Plan for profitability with views of actual inventory counts aligned with true segment opportunity.
The Weekly Sales Summary provides quick feedback to the dealer on sales activities in the Trade Zone by FCA brands and competitors.

Stay ahead of the constantly evolving market. Track weekly sales vs. your competitors, and receive key performance alerts so you can make fast decisions.
Plan for profitability with views of actual inventory counts aligned with true segment opportunity.
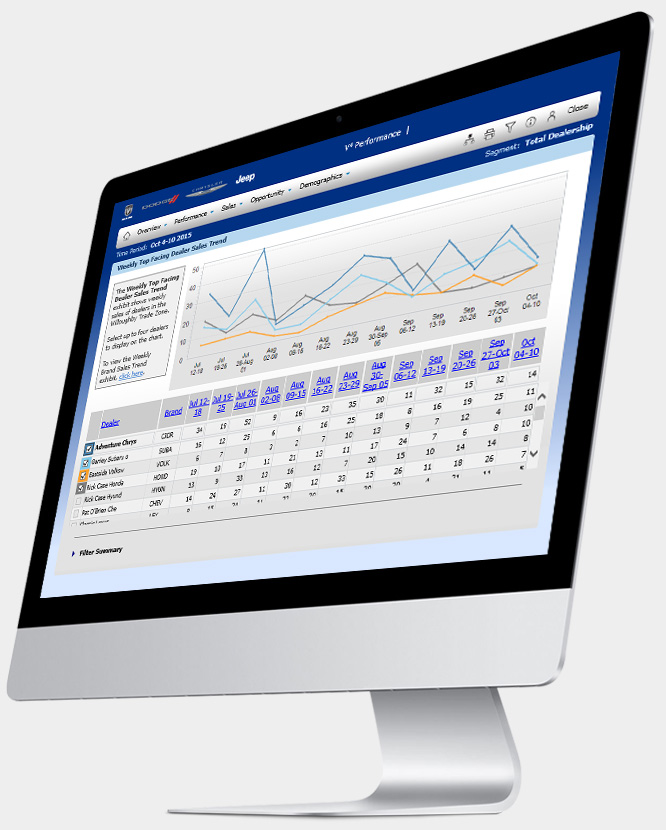
The Weekly Top Facing Dealer Sales Trend exhibits show weekly sales of dealers in the Trade Zone to understand what neighboring competitive dealers are selling each week.
Stay ahead of the constantly evolving market. Track weekly sales vs. your competitors, and receive key performance alerts so you can make fast decisions.
Plan for profitability with views of actual inventory counts aligned with true segment opportunity.
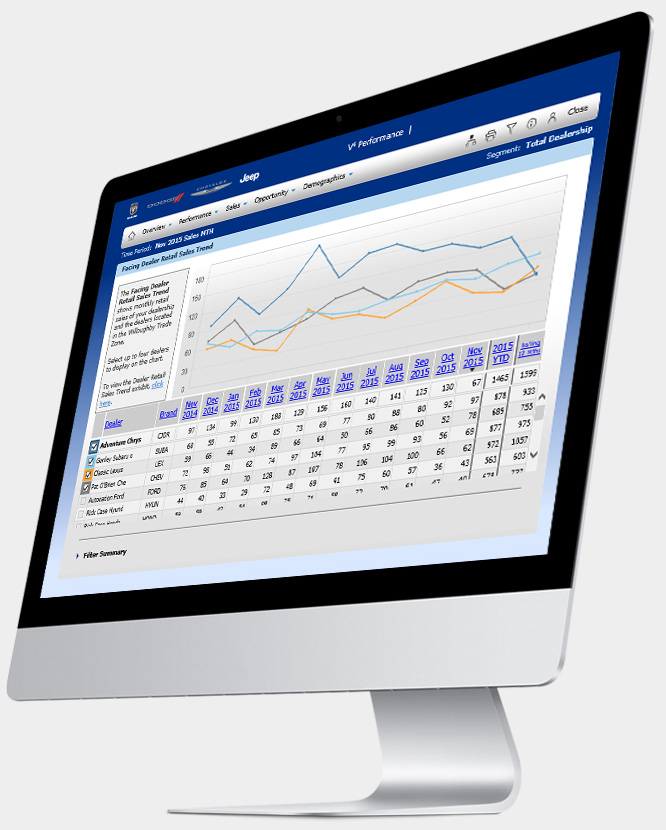
The Facing Dealer Retail Sales Trend uses a 13-month sales trend data to compare your sales performance to the competitive dealers in your Trade Zone.
Stay ahead of the constantly evolving market. Track weekly sales vs. your competitors, and receive key performance alerts so you can make fast decisions.
Plan for profitability with views of actual inventory counts aligned with true segment opportunity.
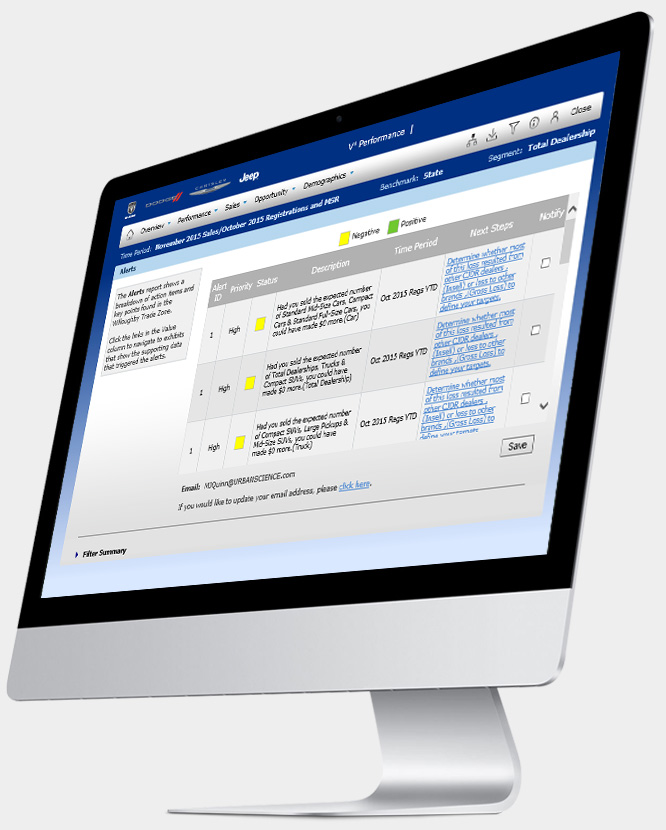
The Alerts prioritize the Trade Zone's Key Performance Indicators that are the most impactful on the performance of the Trade Zone.
© FCA US LLC. All Rights Reserved. Chrysler, Dodge, Jeep, and Ram are registered trademarks of FCA US LLC. FIAT is a registered trademark of FCA Group Marketing S.p.A., used under license by FCA US LLC

